 Paraview
ParaView is an open-source, multi-platform data analysis and visualization application based on Visualization Toolkit (VTK). Whether you are analyzing fluid dynamics (CFD), structural mechanics, or climate simulations, ParaView is built to process anything from a small desktop dataset to massive exascale data on a supercomputer cluster. Understanding ParaView comes down to mastering its Visualization Pipeline concept: you load data, apply filters to transform it, and display the result in a view window.
Installation
yay paraview-gitYou can then open it:
paraviewAlternatively, you can get the latest version for Linux from the official website: https://www.paraview.org/download/
After extraction, you need to open ParaView inside the bin folder:
# or whatever the version is
cd ParaView-6.1.0-MPI-Linux-Python3.12-x86_64
cd bin
./paraview
Interface
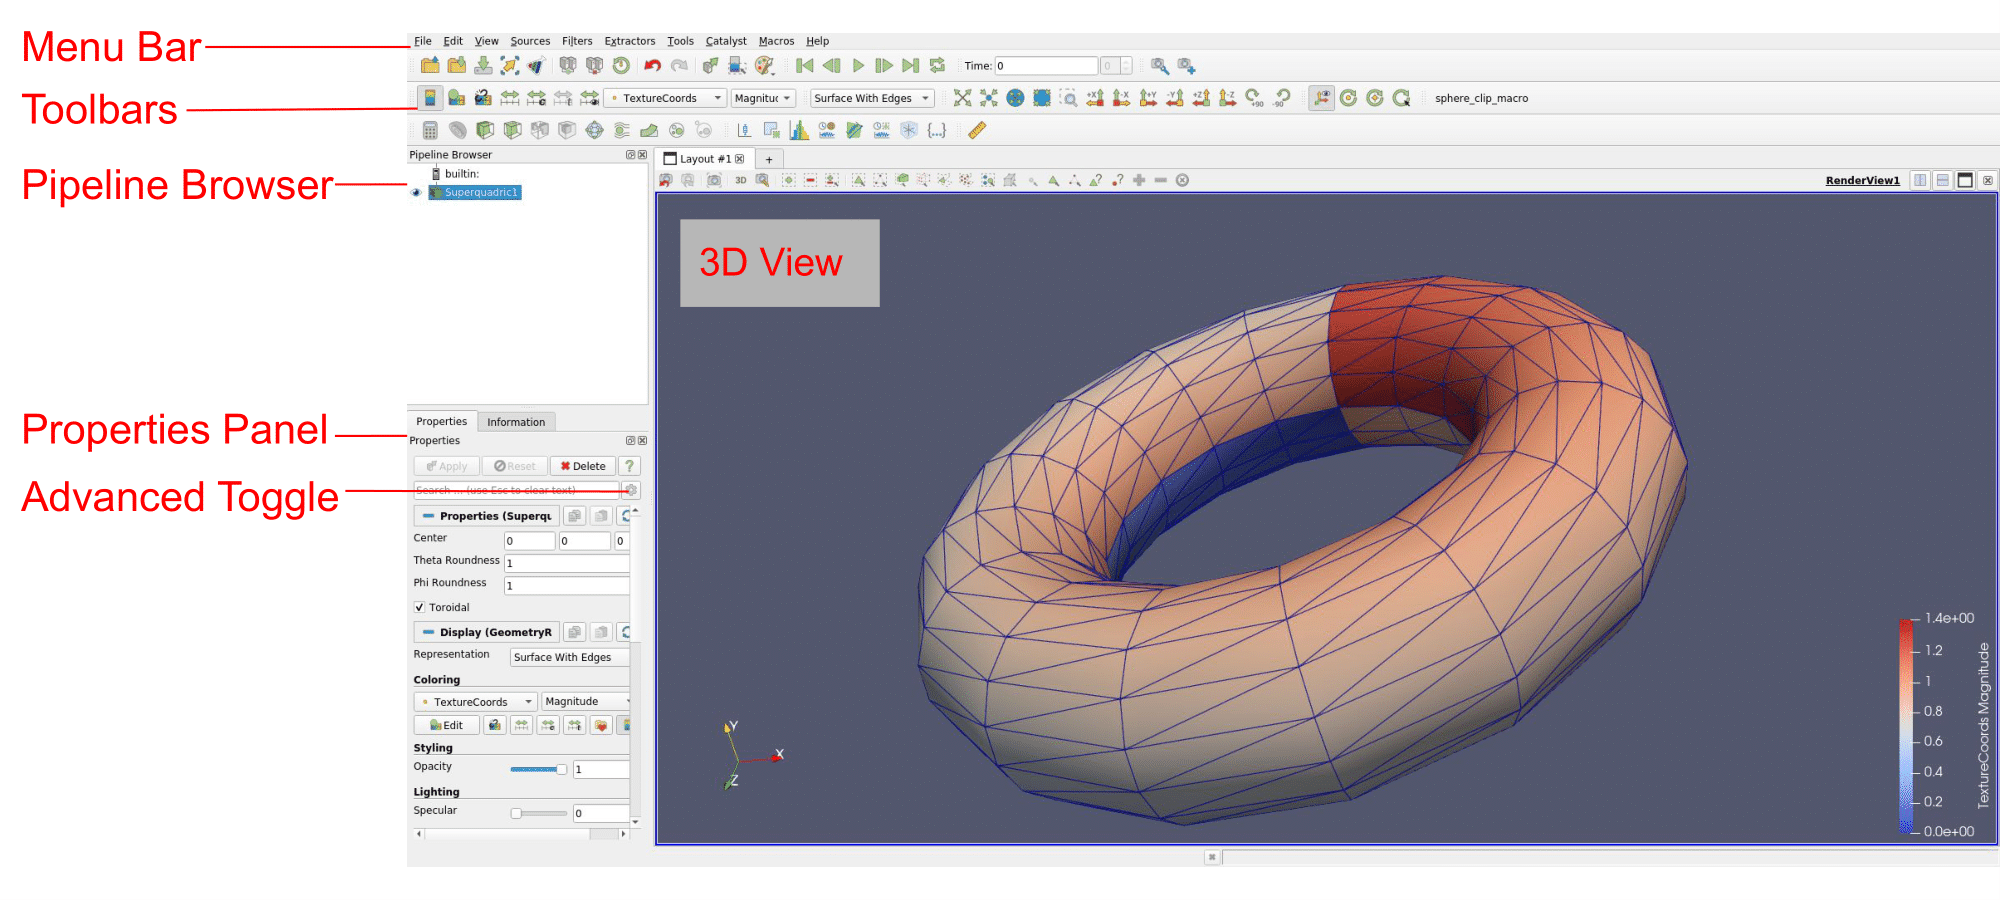
The ParaView user interface is divided in four essential areas:
- The Viewport (Center): The big dark window where your 3D model lives. You click and drag to rotate it.
- The Pipeline Browser (Top Left): Your history tree. It shows your original data file and any filters you have added to it. If you accidentally hide something, you click the little eye icon here to turn it back on.
- The Properties Panel (Bottom Left): The control center. This is where you change the color map, choose which variable to display (e.g., Temperature vs. Pressure), or adjust filter settings.
- The Toolbar (Top): The quick-access buttons. The most important ones for beginners are Play/Pause (for animated data) and the Rescale to Data Range button (which fixes the coloring if your screen looks completely blank or solid blue).
Core Workflow
Every basic task in ParaView follows the exact same three steps. If a beginner memorizes these, they can navigate 90% of the software:
- Load Data: Click File -> Open to bring in your data (like 3D scans, weather data, or fluid dynamics simulations).
- Hit "Apply": This trips up every beginner. ParaView will not show the data automatically because the files can be massive. You have to click the green Apply button in the Properties panel on the left to tell ParaView, "Yes, I am sure I want to load this."
- Apply a Filter: If you want to see inside a 3D block, cut it in half, or show flow vectors, you click Filters at the top, change a setting, and hit Apply again.
If the screen ever looks wrong or completely white, click the 'Rescale to Data Range' button (it looks like a small color bar with a tiny expansion arrow). It resets the colors to fit the actual data numbers, which fixes automatically a lot of mistakes.